

Pitching Velocity Benchmarks by Level
Pitching velocity benchmarks by level are the first thing most pitchers ask about. Velocity gets a coach’s attention, but it’s rarely the only thing that keeps it.
This breaks the ranges down by level and age, and covers what matters beyond the radar gun. For the full picture, see the college baseball level guide.
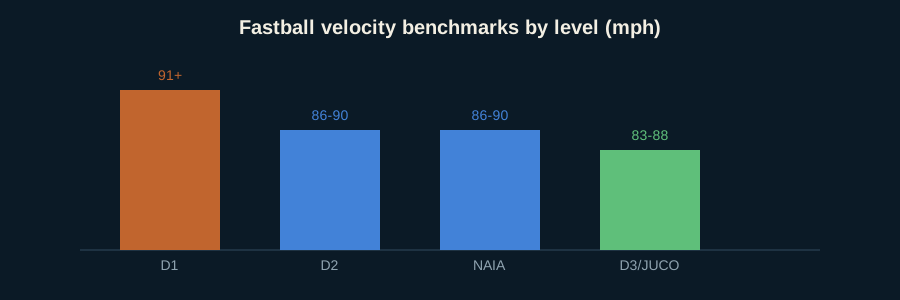
Quick answer: D1 pitchers generally sit in the low-to-mid 90s mph and up, D2/NAIA in the upper 80s to low 90s, and D3/JUCO in the mid-to-upper 80s. Command, a usable second pitch, and a repeatable delivery matter as much as the number itself.
Key takeaways
- Pitching velocity benchmarks run roughly low-to-mid 90s at D1, upper 80s to low 90s at D2 and NAIA, mid-to-upper 80s at D3 and JUCO.
- Pitching velocity benchmarks are read against age: 84 mph means very different things at 15 and at 18.
- Game velocity in later innings is the figure that matters, not a bullpen peak.
- Command and a second pitch keep the attention that pitching velocity benchmarks first earn.
- Workload management protects the arm that has to hold those pitching velocity benchmarks.
Pitching velocity benchmarks by level: general fastball ranges
| Level | Typical range |
|---|---|
| NCAA D1 | Low-to-mid 90s mph and up |
| NCAA D2 | Upper 80s to low 90s mph |
| NAIA | Upper 80s to low 90s mph |
| NCAA D3 | Mid-to-upper 80s mph |
| JUCO | Mid-to-upper 80s mph |
These ranges shift by age and grad year: a 15-year-old at 82 mph and an 18-year-old at 82 mph are read very differently by a coach.
Pitching velocity benchmarks by grad year
The table below sets the same pitching velocity benchmarks against age, which is how coaches actually read a radar reading.
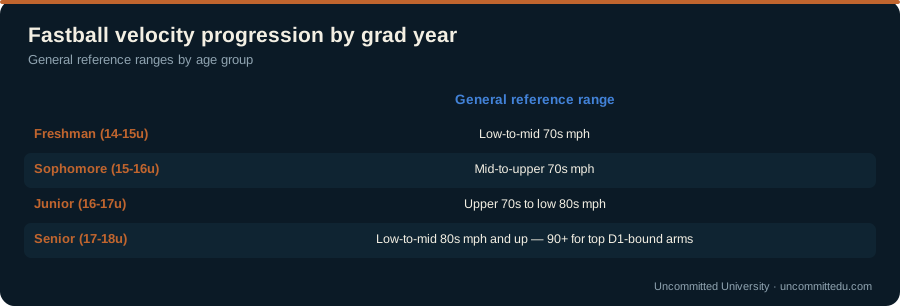
Fastball velocity typically climbs through high school as a pitcher adds strength, refines mechanics, and matures physically. These are general reference ranges from showcase circuits, not a schedule any individual arm has to match:
| Grad year / age group | General reference range |
|---|---|
| Freshman (14-15u) | Low-to-mid 70s mph |
| Sophomore (15-16u) | Mid-to-upper 70s mph |
| Junior (16-17u) | Upper 70s to low 80s mph |
| Senior (17-18u) | Low-to-mid 80s mph and up, 90+ for top D1-bound arms |
Velocity gains aren’t linear. Some pitchers see most of their jump in one offseason tied to a growth spurt; others build gradually over several years through strength and mechanics work. Neither pattern is a red flag on its own.
Pitching velocity benchmarks by age: what to expect
- Freshman year: most gains come from growth and basic mechanics work.
- Sophomore/junior year: the biggest jumps usually happen here, with strength training and refined mechanics.
- Senior year: gains slow but don’t stop: velocity can still climb into and through college.
Track your velocity against the pitching velocity benchmarks over time, not just a single reading. A clear upward trend is one of the strongest signals you can show a coach.
The chart below shows the pitching velocity benchmarks each level generally works from.
Average fastball velocity in high school, by age
The average varsity-track pitcher sits in the mid 60s at 13, around 70 at 14, the low to mid 70s at 15, the upper 70s at 16, the low 80s at 17 and the low to mid 80s at 18. The top ten percent at each age run about eight to ten miles an hour above that, which is where the college conversation starts. These are the consensus ranges the published charts agree on, and they describe pitchers who make a high school roster, not every 15 year old who plays.
| Age | Typical class | Average sitting velocity | Top ten percent | What it means for recruiting |
|---|---|---|---|---|
| 13 | Eighth grade | 55 to 65 mph | 70 and up | Nothing yet. Arm care and athleticism. |
| 14 | Freshman | 62 to 70 mph | 75 and up | Baseline year. Get a first measured number to track against. |
| 15 | Sophomore | 68 to 75 mph | 80 and up | The top group is starting to be noticed at showcases. Everyone else is building. |
| 16 | Junior | 73 to 80 mph | 85 and up | Division I interest begins around 85 with projection. D2, D3 and NAIA recruit from the upper 70s up. |
| 17 | Junior to senior | 76 to 83 mph | 87 and up | The level a number recruits at is set here: 87 and up D1, 82 to 87 D2 and NAIA, 78 to 84 D3 and JUCO, all with command. |
| 18 | Senior | 78 to 85 mph | 90 and up | Last measured number before signing. Sitting velocity matters more than the peak. |
One measured check on the table: in the pitcher blurbs of the 2026 showcase write-ups we read for the 60 times and exit velocity data, the median 16 year old sat at the top of an 86 mph range and the median 15 year old at 82. That sample is 37 pitchers, too small to publish by age, and a showcase pitcher is already the top group, so read it as confirmation of the right-hand column rather than the average.
What matters beyond pitching velocity benchmarks
- Command. An 88 mph fastball that hits its spots consistently often outrecruits a 92 mph fastball with no control.
- A usable second pitch. Coaches want to see at least one reliable secondary offering, not just a fastball.
- Delivery and durability. A clean, repeatable arm action signals fewer injury concerns down the road.
See where your numbers put you
Enter your real velocity and other stats for an honest read across every level.
How pitching velocity benchmarks are actually measured
Radar guns positioned behind the plate or beside the mound are standard at camps and showcases, including events run by organizations like Perfect Game. Ask how many reps are measured: a single peak throw means less than a consistent average across several pitches.
Tools used to track pitching velocity benchmarks
- Handheld radar gun: the most common tool at high school games, travel ball, and most showcases. Simple, portable, and widely trusted, though it only captures speed.
- Pocket Radar: a compact, consumer-grade radar unit many players and families use for at-home bullpen tracking between events.
- Rapsodo Pitching: adds spin rate, movement profile, and release metrics on top of velocity, increasingly common at training facilities.
- Trackman: the system most college programs use, capturing velocity alongside spin rate, extension, and pitch movement in one pass: this is generally the standard college staffs trust most.
A velocity number alone tells a coach less than a velocity number paired with spin and movement data, especially for a breaking ball.
How to actually build velocity
Climbing through the pitching velocity benchmarks happens in the order below, and skipping the first two steps is what injures arms.
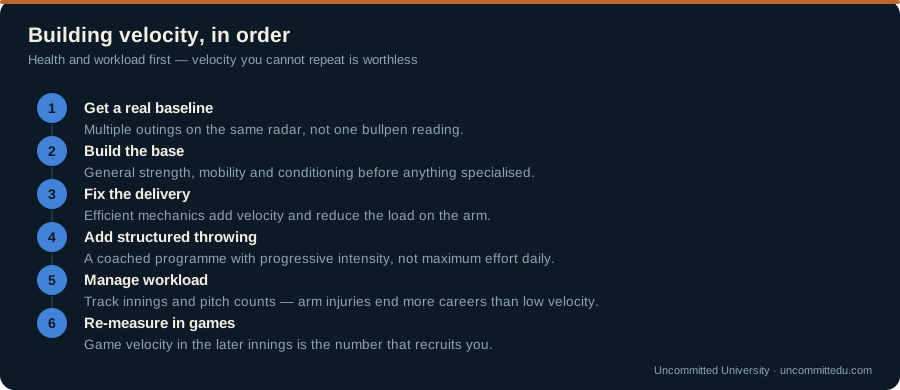
- Strength train the whole kinetic chain, not just the arm: legs and core generate most of a pitcher’s velocity, with the arm acting more as the final link than the source.
- Add a structured throwing program (long toss, plyo balls, weighted balls under supervision) rather than just throwing harder in bullpens.
- Fix mechanics before adding effort. A pitcher with an inefficient delivery who simply tries to throw harder often just adds injury risk without adding velocity.
- Re-test on a schedule, ideally with the same gun or system each time, so gains are measured consistently rather than guessed at.
Velocity development programs that ignore mechanics or workload tend to produce short-term spikes followed by injury, not sustainable gains.
How pitch mix affects your recruiting profile
Velocity gets your foot in the door. What you throw next decides how far it goes.
- A reliable breaking ball (curveball or slider) is usually the first secondary pitch coaches want to see.
- A changeup that shows real velocity separation from your fastball adds another layer.
- Two usable pitches beyond the fastball often matters more at the college level than a third, less refined one.
Depth of a pitch mix, not just velocity, is what separates a projectable arm from a max-effort one.
Injury risk and workload management
Chasing velocity too aggressively without proper training can increase injury risk. Coaches notice this too: a durable arm is worth more long-term than a fragile one that throws hard for one season.
- Follow proper pitch count and rest guidelines for your age
- Build velocity through strength and mechanics work, not just max-effort bullpens
- Track any arm soreness and address it early, not after it becomes serious
Common mistakes pitchers make chasing velocity
The habits below cost pitchers more than any gap in the pitching velocity benchmarks ever does.
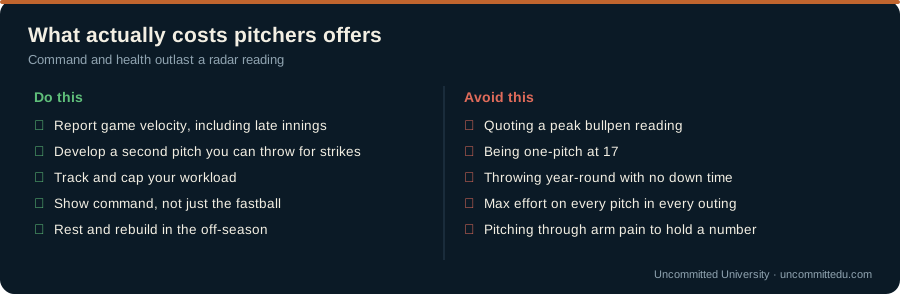
- Max-effort bullpens with no purpose. Throwing as hard as possible every session without a plan tends to plateau quickly and raises injury risk.
- Skipping the strength and mobility work. Velocity is a byproduct of how efficiently the whole body moves, not just arm strength.
- Reporting only the best throw of the day. Coaches increasingly ask for a consistent range across an outing, not a single top reading from a bullpen.
- Neglecting secondary pitches while chasing mph. A pitcher who adds 3 mph but loses feel for a breaking ball often recruits worse, not better.
- Ignoring workload across seasons. Pitching year-round without rest is one of the most common paths to an arm injury that erases a season of velocity gains.
Velocity expectations by role
Not every pitching role on a roster carries the same velocity bar, even at the same level:
- Weekend starters are recruited more on the combination of command, pitch mix, and durability across five-plus innings than on peak velocity alone.
- Middle relief often values a pitcher who can handle multiple innings on short rest, with velocity a secondary factor behind consistency.
- Closers and late-inning relievers are frequently held to the highest velocity bar on a staff, since they’re asked for one or two high-effort innings rather than a full start’s worth of pitches.
A pitcher who knows which role they project into can present their velocity in the right context instead of comparing themselves to a number that doesn’t apply to their likely job.
Common myths about pitching velocity
- “Velocity is all that matters at the next level.” It opens conversations, but staffs still cut pitchers who can’t command a fastball or throw a competitive second pitch.
- “Radar guns are always accurate.” Gun placement, angle, and calibration all introduce small variances: a number a few mph off from another gun on the same pitch isn’t unusual.
- “If I’m not throwing hard by 15, I’m behind.” Plenty of pitchers see their biggest velocity jumps at 16, 17, or even in college, tied to a late growth spurt or a first real strength program.
- “Weighted balls are dangerous no matter what.” Used within a structured, supervised program they’re a widely used development tool; used without guidance or workload management, they do carry real risk.
Questions to ask before trusting a velocity reading
- What device recorded this number, and how many pitches were measured?
- Was this a bullpen reading, a live at-bat reading, or an in-game reading?
- How recent is the number, and has training or growth changed since then?
- Does the number hold up over a full outing, or only on the first few pitches?
Why your radar reading moves, and what pitching velocity benchmarks assume
Two guns on the same fastball can disagree by several miles an hour. That is not a defect, and it is not anyone cheating.
The main reason is where the pitch gets measured. A reading taken close to release is faster than one taken near the plate, because the ball is decelerating the whole way. Published pitching velocity benchmarks are normally out-of-hand numbers.
Gun position matters as much. A radar directly behind the mound or the catcher reads the pitch straight on. One off to the side reads a component of the speed and comes in low.
Equipment differs as well. Stadium systems, handheld guns and consumer units are all calibrated differently, and a showcase number and a summer-league number are not automatically the same scale.
Then there is the difference between peak and working velocity. Touching 90 once in the first inning is not the same as sitting 87-88 into the fifth, and pitching velocity benchmarks quoted at coaches usually mean the peak.
Coaches care much more about the second number. Ask any recruiting coordinator what they want and they will describe the range you hold, not the number you touched.
Conditions move it too. Warm weather, a good mound, adrenaline at a showcase and a well-timed warm-up all add. A cold April Tuesday takes some back.
So report velocity the way a coach would want it: the range you sit, the peak, when it was recorded, and on what. A pitcher who says 86-88, touched 90, gun behind the plate, June is instantly more credible than one who says 90.
And do not chase the number at the cost of the arm. Command, a usable second pitch and staying healthy have moved more pitchers up levels than raw velocity ever has.
Frequently asked questions about pitching velocity benchmarks
How fast should a 15 year old throw? An average sophomore varsity pitcher sits 68 to 75 mph. The top ten percent of 15 year olds sit 80 and above, and that is the group showcase scouts start writing about. Below 68 at 15 is not a verdict; the biggest velocity jump most pitchers ever get comes in the sophomore and junior off-seasons with a growth spurt and a first real strength program. Measure on the same gun each month and watch the trend, not the reading.
How fast do most D1 pitchers throw? Across a Division I staff the fastball sits about 88 to 92 mph, with weekend starters and closers at the top programs sitting 92 to 96 and touching higher. A recruit is evaluated on where he will be, not where he is, so a 17 year old sitting 86 to 88 with a clean delivery and a projectable frame gets Division I looks, and a 17 year old sitting 90 who cannot find the zone often does not.
Is throwing 70 mph at 13 good? Yes. The average 13 year old pitcher sits in the mid 60s and 70 is the top ten percent for the age. It tells you the arm is ahead of the curve, and nothing else yet: coaches do not recruit 13 year olds and the number that matters is the one at 16. Protect the arm, play other positions, and re-measure each spring.
What is a good fastball velocity for a high school pitcher? It depends on grad year and target level, but low-to-mid 80s mph is a reasonable range for an underclassman, while D1-caliber senior pitchers are often in the low-to-mid 90s. See the level breakdown above for full context.
Does velocity matter more for a starter or a reliever? Relievers, especially late-inning ones, are often recruited with a slightly higher velocity bar since they’re expected to throw at higher effort for shorter stretches. Starters are evaluated more on command and pitch mix across multiple innings.
Can a pitcher without high velocity still get recruited? Yes. Command, a deep pitch mix, and a track record of getting hitters out matter enormously, especially at D3, NAIA, and JUCO levels where velocity ranges are lower and consistency is prized.
How much can velocity realistically improve in one offseason? Individual results vary widely, but a well-structured strength and throwing program over a full offseason can produce meaningful gains for many pitchers. There’s no guaranteed number, and rushing the process increases injury risk.
Is a bullpen velocity reading the same as a game velocity reading? Not usually. Adrenaline, a real hitter, and fatigue across an outing can push in-game velocity in either direction from a bullpen number, which is why coaches weight sustained in-game readings more heavily.
How should a pitcher present velocity on a recruiting profile? List a recent range rather than a single peak number (for example, “topped at 88, sitting 84-86”) along with the date, event, and device used. Pair it with an outing’s worth of video so a coach can see whether the number holds up deep into an appearance.
How to present velocity on a recruiting profile
- Give a range, not just a peak. “Sits 85-87, tops at 89” tells a coach far more than a single top-end number.
- Date every reading. A number from 14 months ago is close to meaningless without context on what’s changed since.
- Name the device. Noting whether a number came from a handheld gun, Pocket Radar, or Trackman helps a coach calibrate how much to trust it.
- Attach video that matches the claim. A velocity number with no supporting film is far less persuasive than one backed by an inning of video showing it holding up.
The short version: pitching velocity benchmarks get a coach to watch, and almost nothing else about you is judged until they do. Build velocity through general strength and efficient mechanics rather than max-effort throwing, track your workload honestly, and report game velocity instead of your best bullpen reading. A pitcher sitting inside the pitching velocity benchmarks for his level with two pitches he can command is a far easier recruit than a harder thrower who cannot.
The short version
Pitching velocity benchmarks describe a range you hold, not a number you once touched. Sitting velocity, measured out of hand, in the middle innings, is what coaches actually recruit.
Uncommitted University advises quoting your range first and your peak second, with the date and the gun. Honest context beats an inflated number every time it gets checked, and it always gets checked.
Age and projection matter here more than at any other position. A 16-year-old sitting 84 with a loose arm and room on his frame is often recruited ahead of an 18-year-old sitting 88 who is physically finished.
That is why pitching velocity benchmarks published by level are a floor to aim at rather than a verdict. Staffs are buying where your arm will be in two years, not only where it is this weekend.
Left-handed pitchers sit lower on most of these scales and still get recruited, because the platoon advantage is worth real velocity. Do not read a right-handed benchmark as your own if you throw left.
Your next step
Pair your velocity with your other metrics: see < href="https://uncommittedu.com/exit-velocity-benchmarks-by-level/">exit velocity benchmarks if you also hit, or what D1 coaches actually look for by position.
Written by Wayne Keeton, founder of Uncommitted University.