

What College Baseball Level Am I?
Every player wants to know one thing: what college baseball level do I actually fit? Not what level you hope for. Not what a parent or coach guesses. What your real, measured numbers say.
This guide answers what college baseball level fits you, walking through the actual benchmarks coaches use (by position, by level, by age) so you can build a target list grounded in reality, not wishful thinking.
Quick answer: Coaches at each level use rough benchmark ranges for velocity, exit velocity, and speed, but no single number decides anything. Fit depends on your full profile: metrics, position, academics, and how you compare to a program’s actual roster needs. Use benchmarks as a guide, not a verdict.
Key takeaways
- What college baseball level you fit is answered by three numbers: exit velocity, fastball velocity and a timed 60.
- Benchmarks are ranges, not cut-offs: no single number decides what college baseball level suits you.
- What college baseball level fits you changes by position, not just by raw number.
- Age matters: what college baseball level a number implies differs at 15 and at 18.
- Measure repeatedly on the same device before deciding what college baseball level to target.
- The honest answer to what college baseball level you fit is usually a spread, not one level.
- Turn the answer into a written target list, or the question stays theoretical.
- Coaches re-measure everything in person, so what college baseball level you claim has to hold up live.
What college baseball level am I? Why benchmarks matter
Benchmarks tell you roughly where you stand. They don’t account for projection, work ethic, or how a coach values your specific role.
A player with average numbers but elite makeup and a projectable frame can out-recruit a player with better raw numbers and less upside. Use benchmarks as a starting point, not a ceiling.
Exit velocity: what college baseball level your bat fits
Exit velocity (how hard the ball comes off the bat) is one of the most-tracked hitting metrics in recruiting. General ranges coaches reference:
| Level | Typical exit velocity range |
|---|---|
| NCAA D1 | Upper-90s mph and above, position-dependent |
| NCAA D2 / NAIA | Low-to-mid 90s mph |
| NCAA D3 / JUCO | High 80s to low 90s mph |
These are general references, not hard cutoffs. Power alone doesn’t get a player recruited: contact ability, approach, and defensive value all factor in.
Exit velocity readings also vary by how they’re captured. A number from a radar gun behind the cage during a live at-bat, a Trackman unit at a showcase, and a Rapsodo reading off a tee can all differ by a few mph for the same swing. Coaches know this, which is why one big number from a single event rarely moves a recruiting board on its own, they want to see it repeat across multiple looks, ideally in game action against real pitching, not just in a controlled cage setting.
Go deeper: exit velocity benchmarks by level, broken down further.
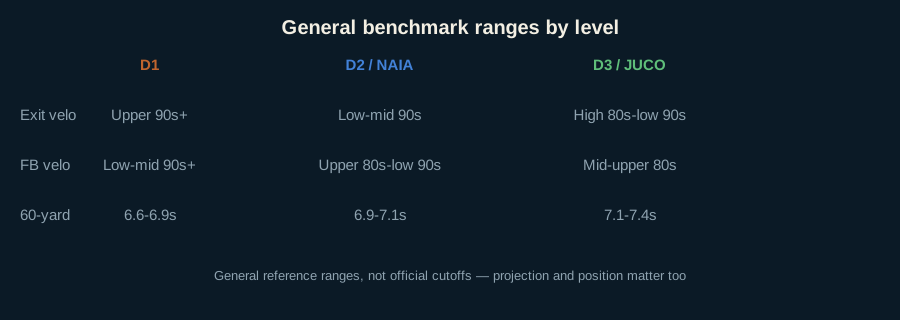
The overview below shows the three numbers that answer what college baseball level fits you.
Pitching velocity: what college baseball level your arm fits
Fastball velocity is the first number a coach looks at, but command and secondary pitches matter just as much for an actual offer.
| Level | Typical fastball velocity range |
|---|---|
| NCAA D1 | Low-to-mid 90s mph and up |
| NCAA D2 / NAIA | Upper 80s to low 90s mph |
| NCAA D3 / JUCO | Mid-to-upper 80s mph |
A pitcher who commands an 88 mph fastball with a real breaking ball often recruits better than one who throws 92 mph with no command.
Velocity readings also carry an asterisk worth knowing: a bullpen number and a live, in-game number are not the same thing. Plenty of arms sit a mile an hour or two lower once adrenaline, a real hitter, and six innings of fatigue enter the picture. Coaches weigh sustained, in-game velocity over a single top-end bullpen reading, and they pay close attention to whether velocity holds up in the sixth inning the same as it did in the first.
Go deeper: pitching velocity benchmarks, broken down by age and level.
60-yard dash: what college baseball level your speed fits
Speed matters differently by position, but the 60-yard dash is the standard measurement coaches reference across the board.
| Level | Typical 60-yard dash range |
|---|---|
| NCAA D1 | 6.6-6.9 seconds, faster for speed-first roles |
| NCAA D2 / NAIA | 6.9-7.1 seconds |
| NCAA D3 / JUCO | 7.1-7.4 seconds |
Corner power positions get more leeway on speed. Middle infielders and outfielders need it more.
The range within a level is often wider than the range between levels. A D1 corner outfielder with elite power might run a 7.0, while a D1 center fielder who profiles as a table-setter might need a 6.7 just to be considered at that position. Speed is evaluated against the job a player is being recruited to do, not against a single flat number that applies to everyone at that level.
Go deeper: 60-yard dash benchmarks by position and level.
See where your actual numbers put you
Skip the guesswork. Enter your real stats and get an honest read across D1 through JUCO.
D1 baseball requirements at a glance
A Division I roster in 2026 carries 34 players, and the arms on it mostly sit 90 mph or better, the bats mostly show upper-90s exit velocity, and every one of them cleared 16 core courses with at least a 2.3 GPA. Those are the D1 baseball requirements in one sentence. Everything below the table is how those requirements bend by position, age and program, and they bend a lot more than the top of the table suggests.
| Requirement | Typical D1 mark | What moves it |
|---|---|---|
| Fastball | Low-to-mid 90s and up, sitting, not touching | Command and a real second pitch recruit an 89 ahead of a wild 93. Left-handers get a little more room. |
| Exit velocity | Upper 90s and above off a tee or in BP | Corner bats need it most. A middle infielder or catcher who defends recruits with less. |
| 60-yard dash | 6.6 to 6.9 seconds | Center fielders and shortstops live at the fast end. Catchers and first basemen are judged elsewhere. |
| Catcher pop time | Under 2.0 seconds | Receiving and blocking on video matter as much as the number. |
| Infield and outfield arm | Mid 80s across the infield, upper 80s from the outfield | Accuracy on video, not the radar peak. |
| Academics | 16 core courses, 2.3 core GPA, Eligibility Center certified | A hard floor, not a target. Selective programs recruit to their admissions bar, which is higher. |
| Roster reality | 34 players, all can be on scholarship since the House settlement | Fewer spots than before 2025, so the average D1 mark moved up, not down. |
The athletic marks are general reference ranges, the same ones coaches quote at showcases, not an NCAA rule. The academic floor is a rule. Read the NCAA eligibility guide for the exact core-course list, and the D1 by position breakdown for what each spot on the field is actually judged on.
What the numbers look like by age: 496 measured 60 times
A 15 year old running a 7.36 is right at the middle of measured players that age, and a 17 year old at the same time is in the slower half. The same number means a different level at a different age. The table is from 496 timed 60-yard dashes at public showcase events in summer 2026, across nine states, taken from the published event write-ups and grouped by the age each player was that summer. It is the only part of this page built on measured runs rather than reference ranges.
| Age in summer 2026 | Class | Timed runs | Faster quarter | Median | Slower quarter |
|---|---|---|---|---|---|
| 17 | 2027 | 116 | 6.98 | 7.18 | 7.41 |
| 16 | 2028 | 141 | 6.95 | 7.19 | 7.47 |
| 15 | 2029 | 79 | 7.13 | 7.36 | 7.60 |
| 14 | 2030 | 115 | 7.48 | 7.76 | 8.07 |
| 13 | 2031 | 42 | 7.88 | 8.19 | 8.73 |
Read it against the level table above and the gap is obvious: the faster quarter of 17 year olds at a showcase is still slower than the D1 reference range, which is why the honest answer for most juniors is a spread across D2, D3 and JUCO with D1 as the stretch. The full breakdown by grad year and position is on the 60-yard dash benchmarks page. Showcase players skew faster than the average high school roster, so treat the median as a showcase median, not a national one.
Benchmark categories beyond the big three
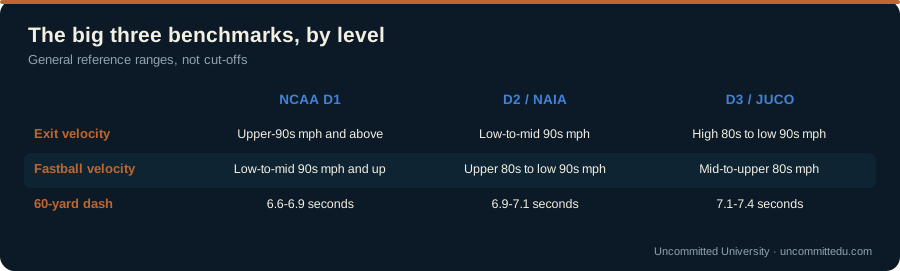
The table below sets those benchmarks out by level, which is the fastest read on what college baseball level suits you.
Exit velocity, pitching velocity, and 60-yard time get most of the attention because they’re easy to measure and easy to compare. They’re not the only numbers on a coach’s sheet.
- Pop time (catchers): the time from catch to glove at second base. Roughly 2.0 seconds and under gets serious D1 attention; 2.0-2.2 covers most D2/NAIA/JUCO catching recruits; anything consistently over 2.3 becomes a real limiting factor regardless of bat.
- Infield/outfield arm strength: often measured in mph off a crow-hop throw. Shortstops and third basemen at the D1 level are frequently in the mid-80s to low-90s mph range; outfield arms get evaluated on both velocity and carry.
- Bat speed: increasingly tracked alongside exit velocity since it’s a better predictor of a hitter’s ceiling than a single exit velo reading, which can be inflated by a well-placed pitch.
- Spin rate (pitchers): a Rapsodo or Trackman number that tells a coach how a breaking ball is likely to play, independent of straight velocity.
None of these show up on every recruiting profile, but the more of them a player can put a real number to, the more complete a picture a coach can build before ever seeing a game in person.
What D1 coaches actually look for, by position
D1 evaluation goes beyond raw numbers. Every position has its own checklist:
- Pitchers: velocity plus command, a usable second pitch, and a repeatable delivery.
- Catchers: pop time and blocking ability, often weighted as heavily as offense.
- Middle infielders: range and hands first, bat second.
- Corner infielders/outfielders: power and bat speed carry the most weight.
Go deeper: what D1 coaches actually look for, by position, in full.
How coaches use these numbers to decide what college baseball level fits
Benchmarks don’t get read in isolation. A college staff usually runs three things side by side before a name ever gets a real look: the measured numbers, the game video, and the roster need at that specific position for that specific class.
- Numbers open the file. A metric in range is often what gets a player onto a coach’s list in the first place: it’s a screening tool, not a decision.
- Video confirms it. Coaches want to see the number show up in competition, against real pitching or real hitters, not just in a showcase setting built to produce a good reading.
- Roster need decides the offer. A program that just landed two shortstops in the last class isn’t taking a third, no matter how good the 60-time is. Fit is as much about timing as it is about talent.
- Academic index matters more than players expect, especially at academically selective D1 and D3 programs, where a borderline metric with a strong transcript can beat a better metric with a weak one.
This is also why two players with nearly identical benchmark sheets can land at very different levels. The numbers get you noticed. Everything around the numbers gets you committed.
Common mistakes when asking what college baseball level you fit
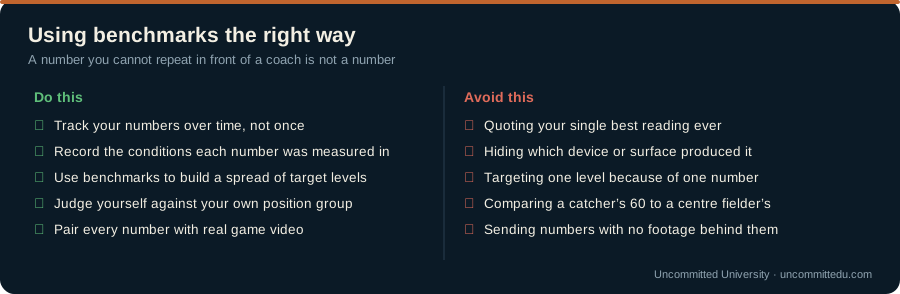
The checklist below covers how to use benchmarks properly when working out what college baseball level fits.
- Chasing one big number instead of a consistent range. A single 95 mph exit velo reading at one event means less than a steady 89-91 across ten games.
- Ignoring the conditions a number was set under. A hand-timed 60 at a small local event and an electronically-timed 60 at a major showcase are not the same measurement, even if the digits match.
- Comparing against viral outliers. A highlight-reel exit velo from a top-50 national recruit isn’t the bar for a realistic target list: it’s a headline, not a benchmark.
- Treating academics as a separate conversation. At every level except some D1 programs with looser standards, academic index and metrics get evaluated together, not sequentially.
- Skipping the re-test. Coaches trust a trend line far more than a single data point, and a player who never updates a number after a growth spurt or an offseason of training is leaving a better story untold.
JUCO baseball explained
JUCO gets treated as a fallback option. That’s usually a mistake. It’s a real developmental path: many players use it to add strength and raise their academic standing, then transfer up with a far stronger recruiting profile.
The benchmark ranges at JUCO overlap heavily with D3, but the ceiling is higher than most families assume. Top JUCO programs regularly send transfers into D1 rosters, and a strong two years there can turn a borderline metric sheet into an easy D1 conversation, especially for players who needed an extra year of physical maturity or an academic reset.
Go deeper: JUCO baseball explained, and why it’s not “lesser”.
NAIA baseball explained
NAIA is often overlooked simply because it’s less familiar to families than the NCAA divisions. Competition at the top programs rivals D2, and scholarship flexibility often beats D2 and D3.
NAIA programs aren’t bound by the same scholarship limits as NCAA divisions, which means a roster can spread aid differently, sometimes to a player’s advantage. Benchmark-wise, the range sits close to D2, but roster need and program budget vary more widely from school to school than in the more standardized NCAA divisions.
Go deeper: NAIA baseball explained, in full.
How to turn what college baseball level you fit into a target list
The steps below turn what college baseball level you fit into an actual target list.
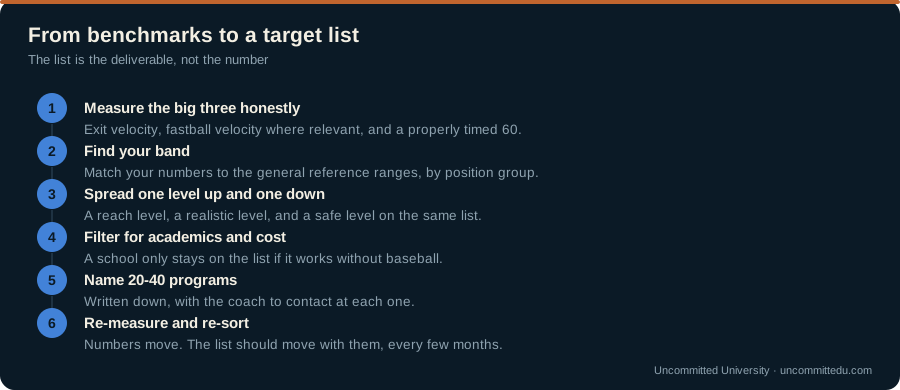
Once you have real numbers instead of guesses, the actual list-building process is straightforward:
- Start with your current, verified numbers: not your goal numbers, not last year’s numbers.
- Sort programs into three tiers: a few reach schools where you’re below the typical range but growing fast, a solid core where you’re squarely in range, and a few safety schools where you’re comfortably above it.
- Cross-check academics against athletics at every tier. A program can be a great athletic fit and a poor academic fit, or the reverse, both matter equally.
- Re-run the list after every re-test. A list built on eighth-grade numbers, or even fall-of-junior-year numbers, goes stale fast.
- Talk to a coach, not just a website. Published rosters and average walk-on times are a starting point; a real conversation with a coaching staff about actual roster need is what turns a target list into an offer.
A target list weighted too heavily toward reach schools leads to a long, discouraging recruiting process. A list weighted too heavily toward safety schools can leave real opportunity on the table. The benchmarks in this guide exist to help calibrate that balance honestly.
Where these benchmark ranges come from
These ranges reflect widely used recruiting industry reference points: the same general bands published by major showcase organizations like Perfect Game and referenced by college coaching staffs. They aren’t an official NCAA standard, and no organization publishes one: the NCAA’s own recruiting rules govern contact and eligibility, not performance cutoffs.
Treat every range on this page as a general guide, not a pass/fail line.
How to use benchmarks without over-relying on them
- Compare your real numbers to a range, not a single cutoff
- Weigh position-specific value: a plus defensive catcher doesn’t need D1 exit velo
- Factor in projection: coaches recruit trajectory, not just a snapshot
- Use benchmarks to build a realistic, multi-level target list, not to rule levels out entirely
Tracking your numbers to see what college baseball level you are trending toward
A single measurement is a snapshot. What actually matters to a coach is your trend.
- Re-test every few months, under similar conditions each time
- Keep a simple log (date, event, number) so you can show real progress
- Update your recruiting profile every time a number changes meaningfully
A player trending up from a modest starting point is often more attractive than one who’s plateaued at a higher number.
Frequently asked questions about what college baseball level you fit
How rare is it to play D1 baseball? Rare, and less rare than people think. The NCAA’s own estimate for 2024-25 is that 8.8% of high school baseball players go on to play NCAA baseball at any division: 2.7% at Division I, 2.6% at Division II and 3.5% at Division III. Add the NAIA and junior colleges and the share playing somewhere in college is higher still. Roughly one in 37 high school players makes a D1 roster, and one in 11 plays NCAA baseball at some level.
Is D2 baseball better than D3? On average the top of Division II plays at a higher level than the top of Division III, and D2 programs can offer athletic scholarships (nine equivalencies) while D3 programs cannot. But the ranges overlap heavily: a strong D3 program beats a weak D2 most days, and the selective D3s recruit players with D1 numbers and better transcripts. Pick on the roster, the coach and the school, not the letter.
How long can you play college baseball? In NCAA Divisions I and II, five calendar years from your first full-time enrollment or the academic year after your 19th birthday, whichever comes first, under the age-based model that started in 2026. In Division III and the NAIA, ten semesters of full-time attendance and four seasons. In the NJCAA, two seasons. The eligibility clock guide walks through each one.
Are these benchmarks official NCAA numbers? No. They’re general reference ranges based on common recruiting knowledge, not an official NCAA standard. Use them as a guide, not a rule.
What if I’m below the range for my target level? Look at your full profile: projection, secondary skills, and defensive value all matter. A borderline number with strong makeup can still recruit well.
Do benchmarks change by grad year? Yes. A freshman with numbers in the D2 range may project to D1 by senior year. Track your trajectory, not just a single data point.
Do benchmarks differ for position players versus pitchers? Yes. Position player benchmarks (exit velo, 60 time, pop time, arm strength) get compared across a roster looking for specific defensive and offensive roles, while pitcher benchmarks (velocity, spin rate, command) get compared against a staff’s need for specific roles like a weekend starter or a late-inning reliever.
How much does academics affect fit at each level? More than most players expect. At academically selective D1 and D3 programs especially, a strong transcript can offset a borderline metric, and a weak transcript can keep an otherwise good athlete off a coach’s list entirely.
Should underclassmen worry about these benchmarks yet? Not in a stressful way. Freshmen and sophomores should record numbers to establish a baseline and track growth, but recruiting conversations tend to get serious in the sophomore-to-junior window, once a body and a game have started to mature.
The short version: what college baseball level you fit is a question with a measurable answer, and guessing at it costs players years. Measure the big three honestly, read them against your position and your age, then build a list spanning one level above and one below where you land. Re-measure every few months, because what college baseball level suits you at fifteen is rarely what college baseball level suits you at eighteen.
Your next step
Run your real numbers through the tool built for exactly this.
Find your level, free
Enter your stats, size, and academics and see an honest read across every level.
Then build your target list using the D1 vs. D2 vs. D3 vs. NAIA vs. JUCO breakdown, and start reaching out: see the full recruiting guide for exactly how.
Written by Wayne Keeton, founder of Uncommitted University.