

Baseball Recruiting Statistics (2026)
Baseball recruiting statistics get repeated far more often than they get checked. Most of the figures circulating in team group chats and showcase sales pitches trace back to a blog quoting a blog, and several of them describe scholarship rules that stopped existing on July 1, 2025.
This page is built to be the opposite of that. Every number below is a single sentence you can copy, followed by the primary source it came from, so a writer, a coach or a parent can check it in one click. These are the baseball recruiting statistics that survived verification against the NCAA Manuals, the NFHS survey, the NAIA, the NJCAA and Major League Baseball’s own draft data.
Quick answer: The core baseball recruiting statistics for 2026: 472,598 players competed in high school baseball in 2024-25, and NCAA baseball roster spots equal 8.8% of that population, 2.7% at Division I. Division I scholarship limits were eliminated on July 1, 2025 and replaced by a 34-player roster cap for programs that opted in to the House settlement. 77.3% of the 2026 MLB Draft came out of four-year colleges and only 20.7% came straight from high school.
Updated August 2026. Every figure in these baseball recruiting statistics was re-checked against its primary source this month. Source years are stated inside each sentence on purpose, because participation data, draft data and rulebooks are published on different cycles and any combined figure here says “more than” rather than pretending to an exact total.
Jump to: Top 10 stats | High school to college odds | Scholarships by division | Measurable benchmarks | Recruiting timeline | Roster limits and spots | MLB draft odds | Our own data | Sources and how to cite
The 10 baseball recruiting statistics worth citing
Every one of these baseball recruiting statistics is written as one standalone sentence with its own source, because that is the format a writer actually needs. Copy the line, keep the citation attached to it, and the claim stays checkable. That is the whole design of this set of baseball recruiting statistics.
The 10 headline baseball recruiting statistics
- 472,598 players competed in high school baseball in the United States in 2024-25.
Source: NFHS High School Athletics Participation Survey, 2024-25 - 41,580 athletes played NCAA baseball across all three divisions in 2024-25.
Source: NCAA Sports Sponsorship and Participation Rates Report, 2025 edition - NCAA baseball roster spots equal 8.8% of the high school baseball population.
Source: NCAA Probability of Competing Beyond High School - NCAA Division I baseball roster spots equal 2.7% of the high school baseball population.
Source: NCAA Probability of Competing Beyond High School - Since July 1, 2025, Division I baseball programs that opted in to the House settlement carry a 34-player roster cap with no ceiling on how many of those players get athletic aid, while programs that stayed out remain capped at the old 11.7 scholarship equivalencies.
Source: NCAA Question and Answer: Implementation of the House Settlement, plus Division I Manual Bylaw 17.2 - NJCAA baseball programs may sign a maximum of 30 Letters of Intent or scholarships for 2026-27.
Source: NJCAA 2026-2027 Sports Procedures Chart - NCAA Division I baseball coaches may not make off-campus contact or host a recruit on a campus visit until September 1 at the beginning of the athlete’s junior year.
Source: NCAA Division I Manual, Bylaws 13.1.1.1.1, 13.6.2.1.2 and 13.7.1.2 - 474 of the 613 players taken in the 2026 MLB Draft came from four-year colleges, which is 77.3% of the draft.
Source: MLB Stats API, official 2026 draft results - Only 127 of the 613 players taken in the 2026 MLB Draft came straight out of high school, which is 20.7% of the draft.
Source: MLB Stats API, official 2026 draft results - About 1 in every 3,700 high school baseball players is drafted straight out of high school.
Computed from the MLB Stats API 2026 draft and the NFHS 2024-25 survey: 127 divided by 472,598.
Three of those ten baseball recruiting statistics are corrections rather than facts, and they are the reason this page exists. The 11.7 scholarship figure is history, not a current rule. The NJCAA baseball limit is 30, not the 24 that circulates everywhere. And the Division I recruiting calendar is now two dates, not one. Each is unpacked in full below, with the bylaw named.
How many high school baseball players actually play in college?
NCAA baseball roster spots equal 8.8% of the high school baseball population. That is the honest headline of any set of baseball recruiting statistics, and the wording matters more than the number.
Here is the framing caveat that most baseball recruiting statistics pages get wrong. The NCAA calculates that percentage as total NCAA participants divided by total high school participants across all four grades: 41,580 divided by 472,598. It is a ratio of roster spots to players, not the chance that a given senior signs somewhere, and baseball recruiting statistics that blur the two are answering a different question. Written as “your odds are 8.8%” it becomes a different claim, and a false one.
472,598 players competed in high school baseball in the United States in 2024-25. Baseball ranked fifth among boys sports in that survey. Source: NFHS High School Athletics Participation Survey, 2024-25.
41,580 athletes played NCAA baseball across all three divisions in 2024-25. Source: NCAA Sports Sponsorship and Participation Rates Report, 2025 edition.
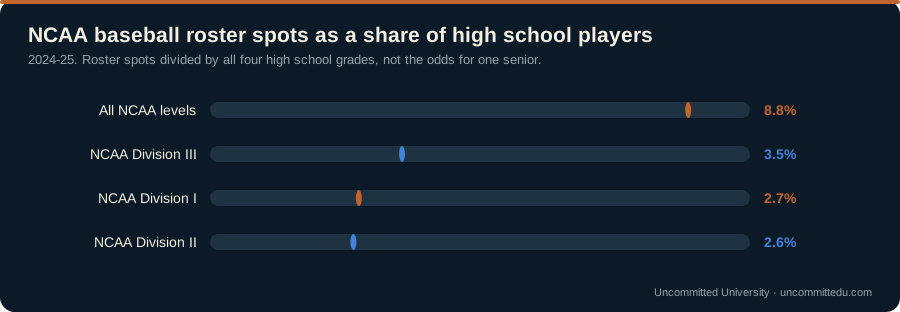
The division split is where the useful baseball recruiting statistics live, because the levels are nothing like equal in size.
| Level | Players, 2024-25 | Share of the high school population |
|---|---|---|
| All NCAA | 41,580 | 8.8% |
| NCAA Division III | 16,562 | 3.5% |
| NCAA Division I | 12,649 | 2.7% |
| NCAA Division II | 12,369 | 2.6% |
NCAA Division III baseball roster spots equal 3.5% of the high school baseball population, the largest share of any division. Division III is the biggest NCAA baseball level by both players and teams, and it is the level most often skipped in a recruiting conversation. Source: NCAA Probability of Competing Beyond High School.
16,562 athletes played NCAA Division III baseball in 2024-25, more than any other division. 12,649 athletes played NCAA Division I baseball in 2024-25. 12,369 athletes played NCAA Division II baseball in 2024-25. Source for all three: the NCAA participation report cited above.
⚠️ One caveat that belongs on the Division I number wherever these baseball recruiting statistics are quoted. 12,649 is the 2024-25 figure, which is the last season before the 34-player roster cap took hold. It describes the level as it was, not as it is, and the next NCAA report should show a sharp Division I drop.
The NCAA is also not the whole college game, which is the single biggest gap in most baseball recruiting statistics roundups. More than 270 NAIA colleges and universities sponsor baseball. Source: the NAIA’s own baseball page, which states the figure as an approximation.
There are more than 1,200 four-year college baseball programs in the United States across the NCAA and the NAIA. That is 944 NCAA baseball teams in 2024-25 plus more than 270 NAIA programs. Junior colleges are excluded from the total because a clean NJCAA team count could not be verified from a primary source, which is exactly why the sentence says “more than” instead of naming a total.
🔴 What we deliberately did not publish: a percentage of high school players who go on to play college baseball at any level, which is the figure most baseball recruiting statistics pages simply invent. Computing it honestly requires NAIA and NJCAA participant counts, and neither body publishes one. Every all-levels percentage you have seen is an estimate built on the same missing data. The 8.8% figure is NCAA-only, and this page says so.
If you are trying to work out which level fits before you read another statistic, start with the honest self-assessment in what college baseball level am I, and the level-by-level breakdown in college baseball divisions, then come back to these baseball recruiting statistics with a shortlist in hand.
How many baseball scholarships are there by division in 2026?
The House settlement eliminated NCAA Division I sport-by-sport scholarship limits on July 1, 2025, so an opted-in program may fund every one of its 34 baseball roster spots. It is the single most important entry in the 2026 baseball recruiting statistics. Source: NCAA Question and Answer: Implementation of the House Settlement.
This is the section where most baseball recruiting statistics go stale, so here is the current mechanism stated precisely. Get this wrong and every downstream number is wrong with it.
Since July 1, 2025, Division I baseball programs that opted in to the House settlement carry a 34-player roster cap with no ceiling on how many of those players get athletic aid, while programs that stayed out remain capped at the old 11.7 scholarship equivalencies. Source: the NCAA House settlement Q&A above, plus Division I Manual Bylaw 17.2.
The precision upgrade almost nobody makes: 11.7 is no longer an NCAA bylaw. The sport-specific aid limits, including Bylaw 15.5.4.1 which held baseball’s 11.7, were struck from the Division I Manual, and a text search of the current 2026-27 Manual finds no 11.7 financial aid limit anywhere.
What 11.7 is now is a trigger line. Award athletic aid above it and the school is pulled into the settlement, roster limit and all. In practice an opted-out program operates at or below 11.7, so the familiar number still describes what those rosters look like, but the mechanism underneath it is a threshold rather than a surviving rule, and baseball recruiting statistics that skip that distinction get the next question wrong.
Before the House settlement, NCAA Division I baseball programs could divide a maximum of 11.7 scholarship equivalencies among their entire roster. That sentence is the only correct way to publish 11.7 in a set of baseball recruiting statistics in 2026: past tense, dated, and marked as history through June 30, 2025.
NCAA Division I baseball has a hard roster limit of 34 players. Bylaw 17.2 lists baseball at 34, adopted June 6, 2025 and effective July 1, 2025, binding each sport of a Division I institution that is a member of a defendant conference or opts in to the settlement. It is one of the few baseball recruiting statistics on this page with a bylaw number attached to it. Source: NCAA Division I Manual, Bylaw 17.2 Roster Limitations.
335 schools are participating in the House settlement revenue sharing model for the 2026-27 academic year. Counted directly from the settlement’s own enforcement body, which makes it one of the newest baseball recruiting statistics available anywhere. Source: College Sports Commission, Participating Schools.
Two details about that list are worth carrying. All current members of the ACC, Big Ten, Big 12, Pac-12 and SEC participate automatically, and every other Division I institution chooses to opt in or out by May 1 each year. Opt-in status is therefore an annual decision, not a one-time 2025 event, which means any set of baseball recruiting statistics naming a specific school’s status has a shelf life of one year.
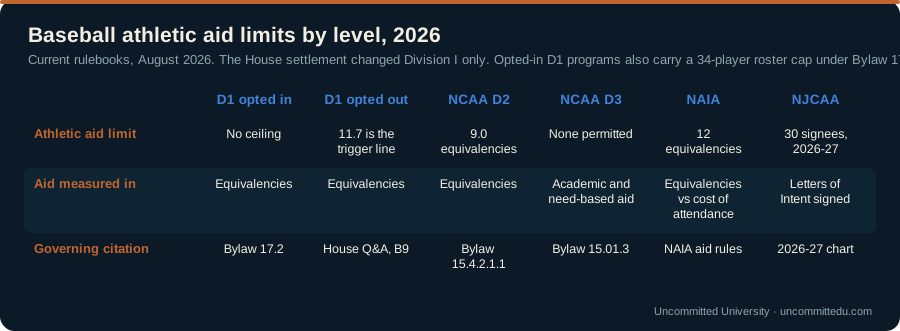
The other four levels did not change, and their baseball recruiting statistics come straight from their own current rulebooks.
| Level | Athletic aid limit for baseball | Governing citation |
|---|---|---|
| NCAA D1, opted in | No scholarship ceiling, 34-player roster cap | House settlement Q&A, D1 Bylaw 17.2 |
| NCAA D1, opted out | 11.7 equivalencies is the trigger line, not a bylaw | House settlement Q&A, Question B9 |
| NCAA D2 | 9.0 equivalencies across the roster | D2 Bylaw 15.4.2.1.1 |
| NCAA D3 | None. No aid may be awarded on athletic ability | D3 Bylaw 15.01.3 |
| NAIA | 12 full scholarship equivalencies | NAIA financial aid rules |
| NJCAA | 30 Letters of Intent or scholarships, 2026-27 | NJCAA 2026-27 Sports Procedures Chart |
NCAA Division II baseball programs may divide a maximum of 9.0 scholarship equivalencies across the roster. The House settlement changed Division I only, and the Division II equivalency table still reads 9.0, which is why Division II baseball recruiting statistics did not move at all in 2025. Source: NCAA Division II Manual, Bylaw 15.4.2.1.1.
NCAA Division III schools may not award any financial aid on the basis of athletic ability, so Division III baseball players receive academic and need-based aid instead. Those packages can still be substantial, they simply cannot be tied to baseball. Source: NCAA Division III Manual, Bylaw 15.01.3.
NAIA baseball programs may award a maximum of 12 full scholarship equivalencies. The NAIA measures an equivalency against full cost of attendance including tuition, room and board, books, fees and supplies, which is a broader base than the NCAA definition. Source: NAIA Financial Aid.
🔴 The correction most baseball recruiting statistics pages need. NJCAA baseball programs may sign a maximum of 30 Letters of Intent or scholarships for 2026-27. The widely repeated 24 is softball’s number on the same chart. Column mapping was sanity checked against three sports whose limits are independently known: football 85, basketball 15, softball 24. Two caveats stay attached: a signee counts against the maximum regardless of how much aid they actually receive, and the chart carries a publisher note that as of December 16, 2025 it is tentative pending Board of Regents meetings. Source: NJCAA 2026-2027 Sports Procedures Chart.
NJCAA Division I programs may grant full athletic scholarships, Division II programs are limited to tuition, fees and books, and Division III programs may not offer athletic scholarships at all. NJCAA divisions are declared per sport rather than per school, so one college can be Division I in baseball and Division III in something else. Source: NJCAA Divisional Structure.
Two words do most of the damage in this section. Limit is what a program is allowed to award. Budget is what a program has actually funded. Baseball recruiting statistics quoted at the limit describe the ceiling of the sport, not the offer in front of you, and funding all 34 spots is permitted rather than required. Cost is the real constraint.
The full mechanics, including how equivalency splits work and what to ask a coach, are in our guide to college baseball scholarships.
What measurable numbers do college baseball coaches actually want?
Division I baseball recruits typically run the 60-yard dash in 6.6 to 6.9 seconds. Source: our own 60-yard dash benchmarks by level, which also splits the ranges by position group. These are the benchmark baseball recruiting statistics a coach actually asks for by name.
These are the baseball recruiting statistics a player can change. Most baseball recruiting statistics describe the sport. These describe you. Roster odds and scholarship budgets are facts about the sport; a 60 time and an exit velocity are facts about you, and they move with training. That is why this section is the one worth reading twice.
Division II and NAIA baseball recruits typically run the 60-yard dash in 6.9 to 7.1 seconds. Division III and junior college baseball recruits typically run the 60-yard dash in 7.1 to 7.4 seconds.
| Level | 60-yard dash | Exit velocity | Fastball velocity |
|---|---|---|---|
| NCAA D1 | 6.6-6.9 sec | Upper-90s mph and above | Low-to-mid 90s mph and up |
| NCAA D2 / NAIA | 6.9-7.1 sec | Low-to-mid 90s mph | Upper 80s to low 90s mph |
| NCAA D3 / JUCO | 7.1-7.4 sec | High 80s to low 90s mph | Mid-to-upper 80s mph |
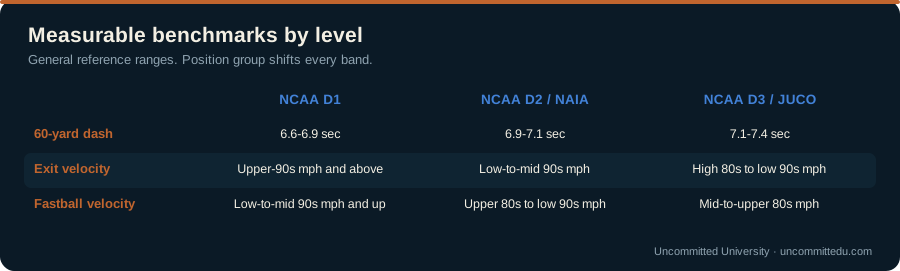
Ranges, not cutoffs. A coach recruiting a shortstop and a coach recruiting a first baseman read the same measurables against completely different priorities, which is why every band above is tied to a position group on the source pages.
- Speed: the full breakdown by level, position group and grad year is in 60-yard dash benchmarks by level.
- Power: the bat side of the profile is in exit velocity benchmarks by level.
- Arm: pitchers get their own bands in pitching velocity benchmarks by level.
- Position fit: what each spot on the diamond is judged on is in what D1 coaches look for, by position.
A warning that belongs beside any published table of benchmark baseball recruiting statistics: a number recorded at a showcase with electronic timing and a number recorded by a parent with a phone are not the same statistic. Coaches weight electronic times more heavily for exactly that reason, and testing conditions move a 60 time by more than most players’ entire year of training does.
When can college coaches actually contact you?
NCAA Division I baseball coaches may first call a recruit or send recruiting materials on August 1 at the beginning of the athlete’s junior year of high school. That is the first of the two timing baseball recruiting statistics that matter, and two separate bylaws set the same date: 13.1.3.1.1 for telephone calls and 13.4.1.1 for recruiting materials and electronic correspondence. Source: NCAA Division I Manual.
🔴 The correction that dates every other page. NCAA Division I baseball coaches may not make off-campus contact or host a recruit on a campus visit until September 1 at the beginning of the athlete’s junior year. Three bylaws set this second date: 13.1.1.1.1 for off-campus contacts, 13.6.2.1.2 for expense-paid official visits, and 13.7.1.2 for unofficial visits involving the athletics department. They carry revision stamps of June 2026, effective August 1, 2026, which is why so many published baseball recruiting statistics are a year out of date on this point. Source: NCAA Division I Manual.
So the Division I calendar is two dates, not one, and the sequence is what these baseball recruiting statistics are really about.
| Date | What opens | Level |
|---|---|---|
| June 15 before junior year | All Division II contact, every sport | NCAA D2 |
| Aug. 1 of junior year | Phone calls, recruiting materials, electronic correspondence | NCAA D1 baseball |
| Sept. 1 of junior year | Off-campus contact, official visits, unofficial visits involving athletics | NCAA D1 baseball |
NCAA Division II coaches may contact a recruit starting June 15 immediately preceding the athlete’s junior year of high school. Division II applies one date across all sports, unlike Division I which carries sport-by-sport exceptions, and it opens roughly six weeks earlier than Division I baseball, a gap worth building a plan around rather than treating as trivia. Source: NCAA Division II Manual, Bylaw 13.1.1.1.
Baseball is itself an exception inside Division I: the general Division I rule is June 15 after sophomore year, and baseball sits later than that. Athletes on a nontraditional academic calendar use the opening day of junior year classes instead of the calendar date.
What these timing baseball recruiting statistics do not say is when recruiting starts. A rule sets when a coach may reply, not when you may act. The month-by-month version of what to send and when is in the college baseball recruiting timeline, and the mechanics of the first message are in how to email a college baseball coach.
How many college baseball roster spots are there?
944 NCAA schools fielded a baseball team in 2024-25. Source: NCAA Sports Sponsorship and Participation Rates Report, 2025 edition.
Team counts are the most stable baseball recruiting statistics on this page, and they are the ones that turn a vague search into a target list. Nothing else here converts into action as directly.
383 schools fielded an NCAA Division III baseball team in 2024-25, more than any other division. 300 schools fielded an NCAA Division I baseball team in 2024-25. 261 schools fielded an NCAA Division II baseball team in 2024-25. Source for all three: the NCAA participation report cited above.
A note on why you may see slightly different figures. The NCAA membership page separately projects 308 Division I, 253 Division II and 381 Division III baseball schools for 2025-26, but labels those numbers projections, so they do not belong in a set of verified baseball recruiting statistics yet. The 2024-25 counts above are the verified ones.
Now the number that changed the math. NCAA Division I baseball has a hard roster limit of 34 players, and average Division I squad size in 2024-25 was 42.2. Every opted-in program is carrying roughly eight fewer players than it did, and the Division I Baseball Oversight Committee raised the championship squad size from 27 to 34 in November 2025 to match the bylaw.
Division II and Division III are not under a roster limit and were larger to begin with: average squad size was 47.4 in Division II, the largest of the three divisions, and 43.2 in Division III.
🔴 What we deliberately did not publish here: a number for how many baseball players enter the transfer portal each year. It is the one entry that did not survive into these baseball recruiting statistics. No primary figure exists in a readable form. The NCAA publishes its transfer research as a dashboard with no static number, and the figure that circulates traces to a trade outlet with no season attached.
So this page says the effect qualitatively and stops: the roster cap pushes players who no longer fit into the portal, where they compete for spots against high school recruits who have never taken a college at-bat. That is a real pressure on a recruit’s odds, and nobody can honestly put a number on its size right now.
The process itself is covered in the baseball transfer portal, and the eligibility side in the NCAA eligibility clock.
What are the odds of being drafted by an MLB team?
Only 127 of the 613 players taken in the 2026 MLB Draft came straight out of high school, which is 20.7% of the draft. Source: MLB Stats API, official 2026 draft results.
That single line is the strongest argument in these baseball recruiting statistics for taking the college route seriously, and it is computed from Major League Baseball’s own pick-level data rather than taken from anybody’s summary.
613 players were selected across 20 rounds of the 2026 MLB Draft. The 2025 draft was 615 players over the same 20 rounds, so the size is stable year to year and the draft baseball recruiting statistics below can be compared across seasons. Source: MLB.com press release.
474 of the 613 players taken in the 2026 MLB Draft came from four-year colleges, which is 77.3% of the draft. 12 of the 613 players taken in the 2026 MLB Draft came from junior colleges, which is 2.0% of the draft. Both computed by grouping all 613 official pick records by school class.
⚠️ Attach a caveat to that junior college figure wherever these baseball recruiting statistics are quoted. The 2025 draft had 31 junior college picks, or 5.0%, so this number swings hard year to year and one season is not a trend.
| Where 2026 draft picks came from | Picks | Share |
|---|---|---|
| Four-year colleges | 474 | 77.3% |
| High school | 127 | 20.7% |
| Junior college | 12 | 2.0% |
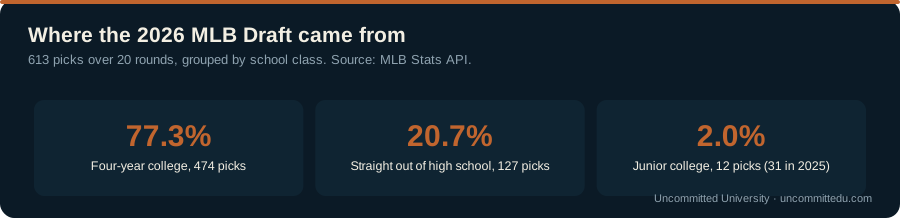
The NCAA publishes the other side of the same question, and these are the baseball recruiting statistics for the rate at which draft-eligible college players actually hear their names.
4.9% of draft-eligible NCAA baseball players were selected in the 2025 MLB Draft. 15.3% of draft-eligible NCAA Division I baseball players were selected in the 2025 MLB Draft. 40.8% of draft-eligible players from the ACC, Big Ten, Big 12 and SEC were selected in the 2025 MLB Draft. Source for all three: NCAA Probability of Competing Beyond High School, Figures and Methodology.
Read those three together and the shape of the sport appears. The gap between 15.3% at Division I and 40.8% in the four autonomous conferences is larger than the gap between Division I and everybody else, and the NCAA adds its own caveat that being drafted is not the same as playing professionally, let alone reaching the Major Leagues.
About 1 in every 3,700 high school baseball players is drafted straight out of high school. That is 127 high school players drafted in 2026 against 472,598 high school participants in 2024-25.
🔑 What that number assumes, stated so you can argue with it. The denominator is all four high school grades, not seniors. Assume instead that roughly a quarter of participants are seniors and the figure becomes about 1 in 930 seniors. The senior split is an estimate rather than a published NFHS figure, so the version printed here is the one carrying no assumption, which is the standard every number in these baseball recruiting statistics is held to. Cross-year comparison is deliberate: the 2025-26 NFHS survey is not out yet.
The reason the draft belongs in a page of baseball recruiting statistics at all is that it reframes the college decision. For the overwhelming majority of players, college is not the last step before professional baseball. It is the step where a degree gets finished, and these numbers say that plainly enough that it should change how a family evaluates an offer.
Baseball recruiting statistics from our own database
Uncommitted U’s recruiting vault holds 6,934 college coach records with real emails and phone numbers. The vault covers 1,649 college baseball programs, searchable by level, state and fit. Both figures are ours, both were read live from our own homepage in August 2026, and both move as the vault updates, which is why they are dated rather than presented as fixed baseball recruiting statistics.
Uncommitted U surveyed 212 college coaches from junior college through Division I to build the evaluation points in the athlete profile. That is the piece of this dataset a public survey cannot replace, and it is the rarest kind of baseball recruiting statistics: what coaches said they actually look at.
Two things worth saying plainly. The program count sits well above the 944 NCAA baseball teams because it also covers NAIA and junior college levels, which is the whole point. And a coach record means a real, named person at a real program, not a generic athletics department inbox.
The practical consequence for a recruit is a denominator that most baseball recruiting statistics never give you. The number of programs where your measurables are genuinely in range is a specific, countable list. It is usually much longer than a family expects and much shorter than a mass email blast assumes.
Measured baseball recruiting statistics we built ourselves in 2026
Three datasets on this site are measured rather than quoted: 1,689 college baseball programs counted by level and state, 496 timed 60-yard dashes by age, and 552 exit velocity readings by age, all from summer 2026. Every number below can be cited with a link to the page that carries the method, and none of it exists on the NCAA’s site.
| Statistic | Number | How it was measured | Where the full table lives |
|---|---|---|---|
| College baseball programs, all levels | 1,689 | Counted from our school directory, 2026 rosters: 309 NCAA D1, 253 D2, 382 D3, 194 NAIA, 511 two-year, 40 USCAA | College baseball divisions |
| Division III baseball programs | 382 in 34 states and DC | Same count; Pennsylvania 57, New York 47, Massachusetts 32 | D3 baseball schools |
| NAIA baseball programs | 194 in 34 states | Same count; Missouri, Indiana and Kansas 14 each | NAIA baseball explained |
| Two-year college baseball programs | 511 in 43 states | About 400 NJCAA, 86 CCCAA, 28 NWAC | JUCO baseball explained |
| Median 60-yard dash by age | 17: 7.18 s, 16: 7.19, 15: 7.36, 14: 7.76, 13: 8.19 | 496 timed runs from 34 public showcase write-ups in 9 states, grouped by age in summer 2026, no names kept | 60-yard dash benchmarks |
| Median max exit velocity by age | 17: 95 mph, 16: 95, 15: 93, 14: 85, 13: 80 | 552 launch-monitor readings from 35 showcase write-ups; batting-practice averages run about ten mph lower | Exit velocity benchmarks |
| Share of showcase 17 year olds at a D1 reference 60 (6.9 or faster) | About one in four | The faster quarter of 138 timed 17 year olds ran 6.98 or better | What level am I |
The showcase samples skew stronger than a typical high school roster, because a showcase is a selected group, so read the medians as the middle of the recruited pool rather than the middle of the sport. The program counts are complete as of September 2026 and move by a handful each year as schools add and drop baseball.
Sources, and how to cite this page
Every one of these baseball recruiting statistics is sourced to the body that published it. Where a number is ours, it is labelled as ours. Where a figure could not be traced to a primary source it was left off this page rather than rounded into place, and each of those omissions is named in the section it would have appeared in.
- NFHS High School Athletics Participation Survey, 2024-25 | high school participation
- NCAA Sports Sponsorship and Participation Rates Report, 2025 edition | NCAA players, teams and squad sizes
- NCAA Probability of Competing Beyond High School | the percentage figures
- NCAA Probability of Competing, Figures and Methodology | draft-eligible selection rates
- NCAA Question and Answer: Implementation of the House Settlement | the opt-in split and the end of sport-by-sport aid limits
- NCAA Legislative Services Database | every bylaw cited here, in the current 2026-27 Division I, II and III Manuals
- College Sports Commission, Participating Schools | the 335 participating schools
- NAIA baseball and NAIA Financial Aid | NAIA programs and the 12-equivalency limit
- NJCAA 2026-2027 Sports Procedures Chart and NJCAA Divisional Structure | junior college limits
- MLB.com, 2026 MLB Draft completion release and the MLB Stats API | draft size and the school-class split
How to cite this page
Web or blog citation:
“Baseball Recruiting Statistics: The Honest Numbers for 2026,” Uncommitted University, August 2026, https://uncommittedu.com/baseball-recruiting-statistics/
Attribution line for a chart or table of baseball recruiting statistics:
Source: Uncommitted University, baseball recruiting statistics, 2026.
If you are quoting a governing body’s figure that appears here, cite that body directly using the source link beside the statistic. We would rather be the page that pointed you to the NCAA than the page that stood between you and it.
Frequently asked questions about baseball recruiting statistics
What percent of high school players go to D1? 2.7 percent. The NCAA’s 2024-25 figure puts Division I baseball roster spots at 12,649 against 472,598 high school players, or about one in 37. Division II is 2.6 percent and Division III 3.5 percent, so the NCAA total is 8.8 percent, and the share playing anywhere in college, including the NAIA and junior colleges, is higher still but not published as a single number.
How many college baseball players are there? 41,580 in the NCAA across all three divisions in 2024-25, by the NCAA’s own participation report. The NAIA and the junior colleges do not publish a comparable player count; what can be counted is programs, and our directory holds 1,689 college baseball programs at every level, so a working estimate at 35 players a roster puts the whole sport near 60,000 college players in a season.
How many college baseball teams are there? 1,689 on the 2026 rosters we track: 309 in NCAA Division I, 253 in Division II, 382 in Division III, 194 in the NAIA, 511 at two-year colleges and 40 in the USCAA. Fewer than one in five four-year programs is Division I, which is the single most useful statistic on this page for a family building a target list.
What percentage of high school baseball players play in college? NCAA baseball roster spots equal 8.8% of the high school baseball population, and 2.7% at Division I. That is a ratio of NCAA roster spots to all four high school grades, not the chance a given senior signs. No honest all-levels percentage exists, because neither the NAIA nor the NJCAA publishes a participant count.
Is 11.7 still the number of D1 baseball scholarships? No. The sport-by-sport limits were struck from the Division I Manual on July 1, 2025. 11.7 now works as a trigger: a program that awards athletic aid above it is pulled into the House settlement, including the 34-player roster cap. Programs that stay under it operate much as before.
How many players are on a D1 baseball roster in 2026? A maximum of 34 at any program that opted in to the House settlement, under Division I Bylaw 17.2. Average Division I squad size in 2024-25, the last season before the cap bound, was 42.2.
How many baseball scholarships does a junior college get? NJCAA baseball programs may sign a maximum of 30 Letters of Intent or scholarships for 2026-27. The 24 figure that circulates widely is softball’s limit on the same chart.
When can D1 baseball coaches contact recruits? August 1 of junior year for phone calls, recruiting materials and electronic correspondence. September 1 of junior year for off-campus contact, official visits and unofficial visits involving the athletics department. Division II opens earlier, on June 15 before junior year.
What percentage of MLB draft picks come from college? 77.3% of the 2026 MLB Draft came from four-year colleges and 20.7% came straight out of high school, computed from all 613 official pick records.
What are the odds of being drafted out of high school? About 1 in 3,700 high school baseball players, using all four grades as the denominator. Roughly 1 in 930 if you assume a quarter of participants are seniors, though that senior split is an estimate rather than a published figure.
The short version
The baseball recruiting statistics that matter are these: 472,598 high school players, 41,580 NCAA roster spots, 8.8% of the population at all NCAA levels and 2.7% at Division I, and only 20.7% of the 2026 MLB Draft taken straight out of high school. Division III is the largest NCAA level by both players and teams, which is the fact most recruiting conversations skip.
Three corrections carry these baseball recruiting statistics. 11.7 is history and now functions only as a settlement trigger. The NJCAA baseball limit is 30, not 24. And the Division I calendar is two dates now, August 1 for the phone and the inbox, September 1 for visits and in-person contact.
Last reviewed: Aug. 12, 2026. Every figure in these baseball recruiting statistics was checked against its primary source on that date. Five claims we wanted to publish could not be traced to one, so they are not on this page at all: the annual transfer portal count, NJCAA team counts, NAIA participant totals, an all-levels college participation percentage, and the 2024-25 count of high schools sponsoring baseball.
Your next step
Baseball recruiting statistics tell you what the sport looks like. They do not tell you where you fit. That takes about two minutes and it is free.
Check your eligibility, free
Answer a few questions and see where you stand across NCAA, NAIA and JUCO before you read another statistic.
Then take the two or three baseball recruiting statistics that actually apply to you, your level and your position, and build a target list from them. That is the whole point of measuring anything.
Written by Wayne Keeton, founder of Uncommitted University.